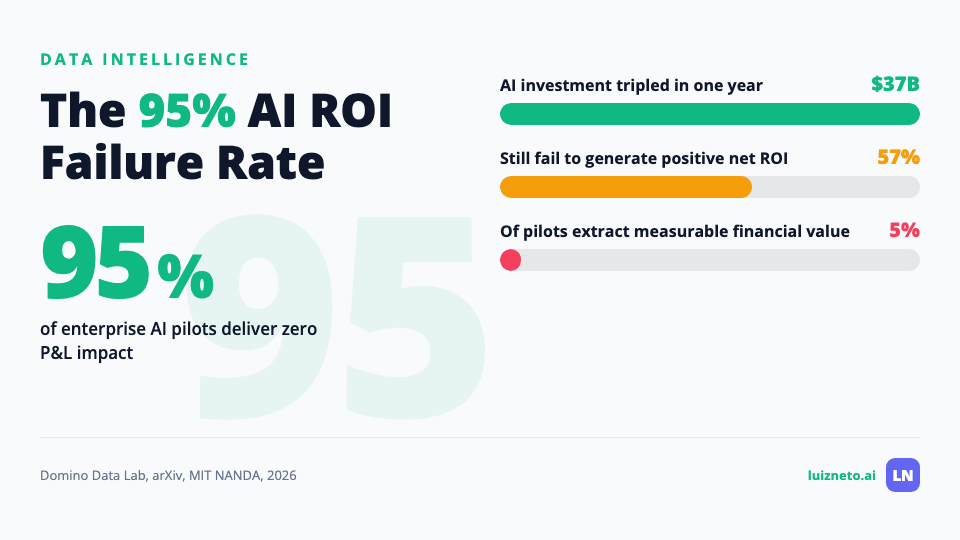
95% of Enterprise AI Pilots Deliver Zero P&L Impact
Enterprise AI investment tripled to $37 billion. The return: 95% of pilots delivered zero P&L impact. Three independent studies converge on that number. The data reveals two AI economies running side by side, and four structural layers that separate the 5% from the 95%.
Enterprise AI ROI Falls to Zero for 95% of Pilots
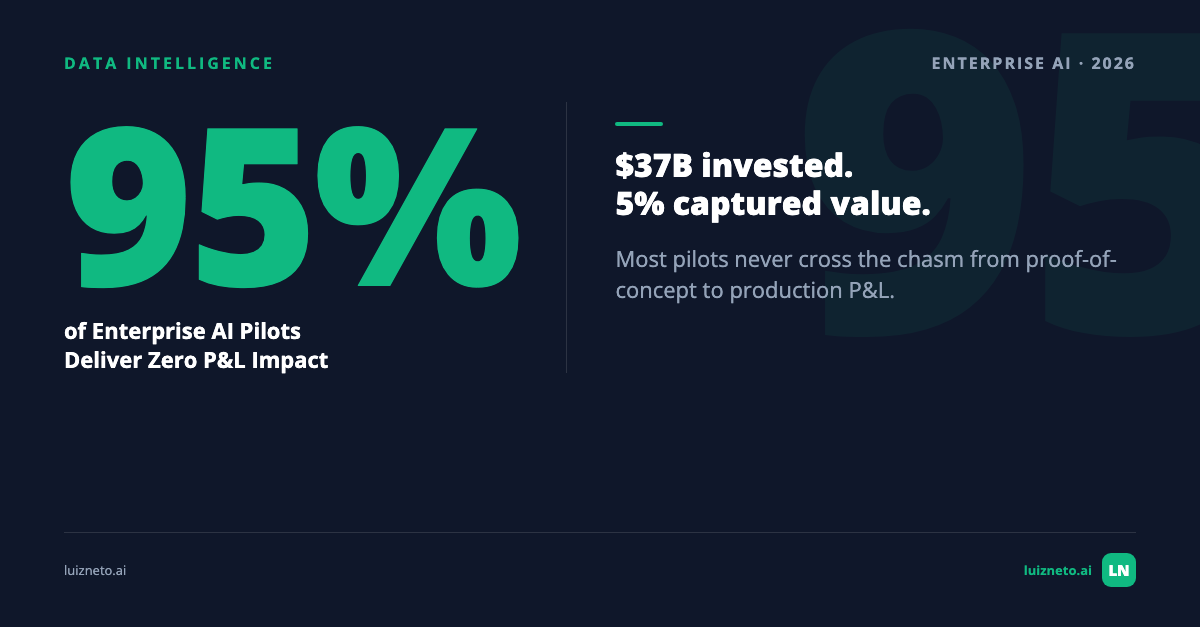
Enterprise investment in generative AI nearly tripled to around $37 billion last year (arXiv, 2026). The enterprise AI ROI on that capital: 95% of those pilots delivered zero measurable P&L impact (Domino Data Lab, 2026). Not low returns. Not disappointing returns. Zero.
A structural failure sits underneath that number, and it has a clear pattern. And the data now reveals something sharper than a simple failure rate: two AI economies running side by side. The top 20% of organizations capture 74% of all AI-driven value (PwC, 2026). Everyone else subsidizes the experiment.
This article maps where the divide sits, what separates the two sides, and what your organization needs to move from one to the other.
Key Takeaways
- 95% of enterprise AI pilots produce zero measurable P&L impact
- Top 20% of organizations capture 74% of all AI-driven value
- Composable architecture creates a 6x ROI advantage over early-stage systems
- Scaled MLOps lifts median ROI from -22% to +287%
- 76% of leaders believe they lead on AI; 10% actually qualify
Table of Contents
- The $37 Billion Experiment With No P&L to Show
- Two AI Economies Running Side by Side
- The Delusion Between the C-Suite and the Floor
- The Pilot-to-Production Wall Nobody Budgeted For
- The Maturity Curve That Predicts Your ROI
- Composable Architecture Is the 6x Multiplier
- The Measurement Problem That Keeps the Distance Open
- The Governance Tax That Pays for Itself
- Enterprise AI ROI FAQ
The $37 Billion Experiment With No P&L to Show
Three independent studies converge on the same number. A 639-respondent field study by Domino Data Lab (2026) found that 95% of enterprise AI pilots produced no measurable financial impact. An academic review of 4.5 million production tests confirmed the same figure (arXiv, 2026). And analysis from MIT's Project NANDA arrived at an identical rate.
Only 5% of integrated pilots generated real financial value. The rest produced demos, dashboards, and slide decks. None of those move the income statement.
The convergence matters. When one survey says 95%, you question the sample. When three independent studies, using different methodologies and different populations, land on the same number, you are looking at a structural feature of the market, not a sampling artifact. The framing is diagnostic, not pessimistic. The 95% tells you where you probably are. The rest of this article tells you what to do about it.
Meanwhile, 57% of enterprises still fail to generate ROI exceeding their AI investments, a figure unchanged since 2025, even as production capabilities rose from 88% to 93% (Domino Data Lab, 2026). More organizations can run AI. Fewer can make it pay. Capability went up. Returns stayed flat. That combination has a name in any other industry: overcapacity.
The problem is not that AI doesn't work. It works in demos and stalls in production. If your AI program's best evidence is a productivity report that never reaches the P&L, you are in the 95%. The question is what the other 5% did differently.
The answer starts with data foundations. Only 7% of enterprises have AI-ready data, and that readiness is upstream of every ROI conversation.
Two AI Economies Running Side by Side
The ROI distribution is bimodal. And the shape of that distribution explains more about AI's business impact than any single statistic can.
PwC's 2026 AI Performance Study surveyed over 1,200 organizations and found that the top 20% capture approximately 74% of all AI-driven economic value. The bottom 80% split the remaining 26%.
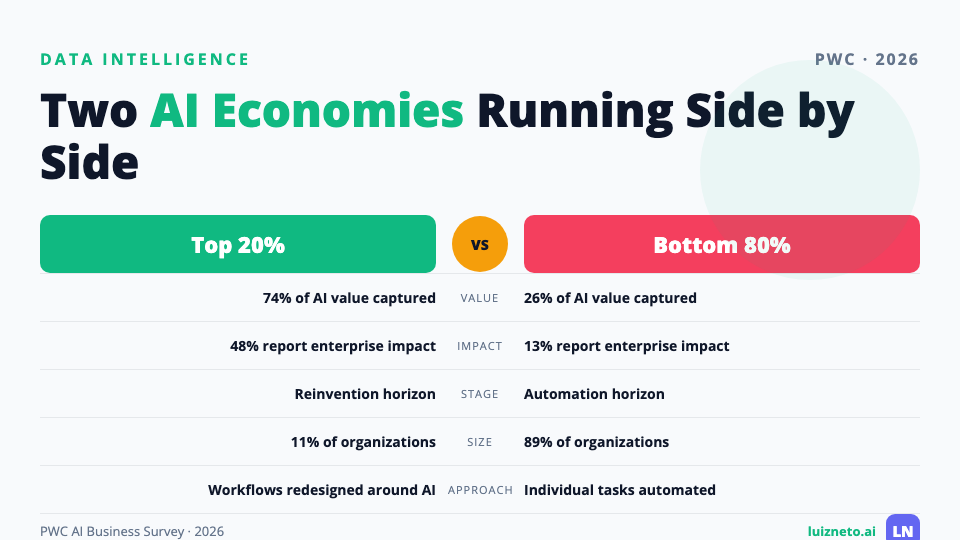
Read that again. Four out of five enterprises share barely a quarter of the value. One in five takes the rest. The distribution follows a winner-take-most pattern. And in a winner-take-most market, the median enterprise subsidizes the leaders. Your AI spending is funding the ecosystem that the top 20% extract value from. Unless you are in that 20%, you are paying for someone else's ROI.
McKinsey's three-horizon framework (2026) sharpens the picture further. Only 11% of organizations have reached the "reinvention horizon," where AI reshapes entire business models. Among those reinvention leaders, 48% report meaningful enterprise-level impact. Among organizations still in the automation horizon, where AI improves individual tasks but does not change the business model, just 13% report the same.
The 48%-versus-13% split tells you the distance between the two AI economies comes down to architecture, not spending. The reinvention organizations moved from automating individual tasks to redesigning entire workflows around what AI can do as infrastructure.
Think of it as two factories sharing the same raw material. One has an assembly line where output is measured at the loading dock. The other has a pile of parts and engineers building prototypes. Both bought the parts. Only one built the line.
The model portfolio is one of those structural decisions. Architecture choices start at the model portfolio, and they determine whether your AI investment compounds or depreciates.
The Delusion Between the C-Suite and the Floor
Here is where the data gets uncomfortable.
EXL's 2026 survey found that 76% of business leaders believe they are ahead of competitors on AI. Only 10% meet the criteria of "AI Leaders." That is a 66-point perception distortion. And it is not harmless. It shapes budgets, timelines, and hiring plans based on a version of reality that does not exist.
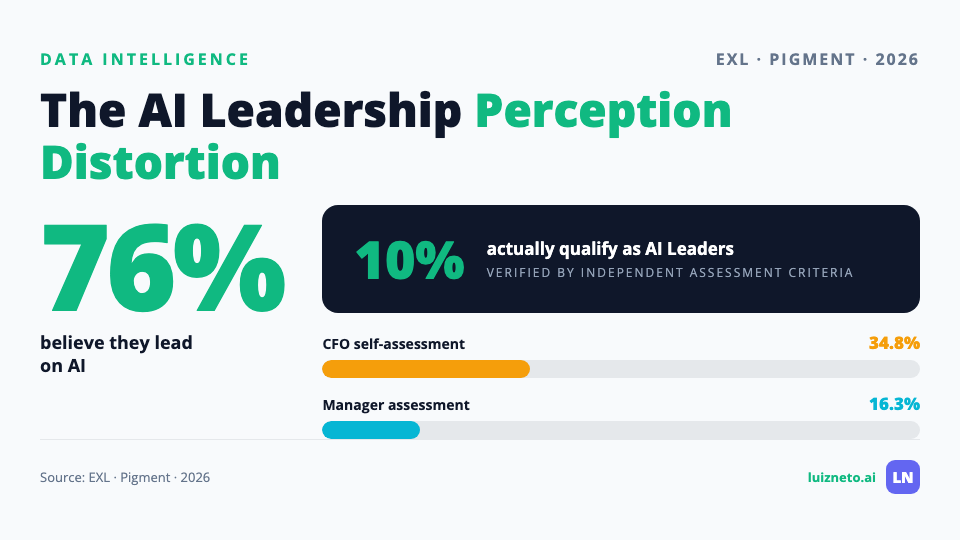
The leaders who do qualify report real results: 27% higher revenue, 26% cost reduction, and 22% improved margins. The distance between believing you lead and actually leading comes down to measurement. When the C-suite sees pilot outputs and the floor sees production reality, they are looking at different dashboards.
Pigment's CFO survey (2026) quantified the vertical version of the same split. CFOs rated their organization's AI maturity as "leading" at 34.8%. Managers rated the same organizations at 16.3%. The people closest to the work see half the maturity the budget owners see.
This is not a cynical point. CFOs see the investment thesis: budget approved, vendor selected, pilot launched, executive sponsor assigned. Managers see the deployment reality: data pipeline broken, model retraining stalled, inference costs running 4x the estimate, the one engineer who understood the deployment on paternity leave. Both are reporting honestly from where they sit. The problem is that no one is translating between the two, and the ROI calculation lives in the space between them.
The perception distortion creates a feedback loop. Leadership allocates budget for the next pilot instead of fixing the infrastructure underneath the current one. More pilots. Same infrastructure. Same zero P&L.
The same dynamic appeared in Wharton's executive education research (2026): 45% of senior executives reported significant ROI from AI investments, compared to 27% of middle managers. The further you sit from the work, the better the numbers look. That gradient is consistent, repeatable, and dangerous because it delays the structural changes the 5% already made.
Ask yourself: when your team reports AI progress, are they reporting adoption metrics or income-statement metrics? If your AI dashboard shows model accuracy, deployment count, and user adoption but does not show revenue impact, margin change, or cost-per-transaction improvement, you are looking at the CFO's version of reality, not the floor's version. The distance between those two answers is the distance between your perception and your actual position. Governance readiness is the stress test that exposes it.
The Pilot-to-Production Wall Nobody Budgeted For
78% of enterprises have active AI pilots. 14% have scaled any to production. The conversion rate improved to 31% in Q2 2026, up from 18% in Q1 (Institute of AI PM, 2026). And that improvement is being celebrated as progress.
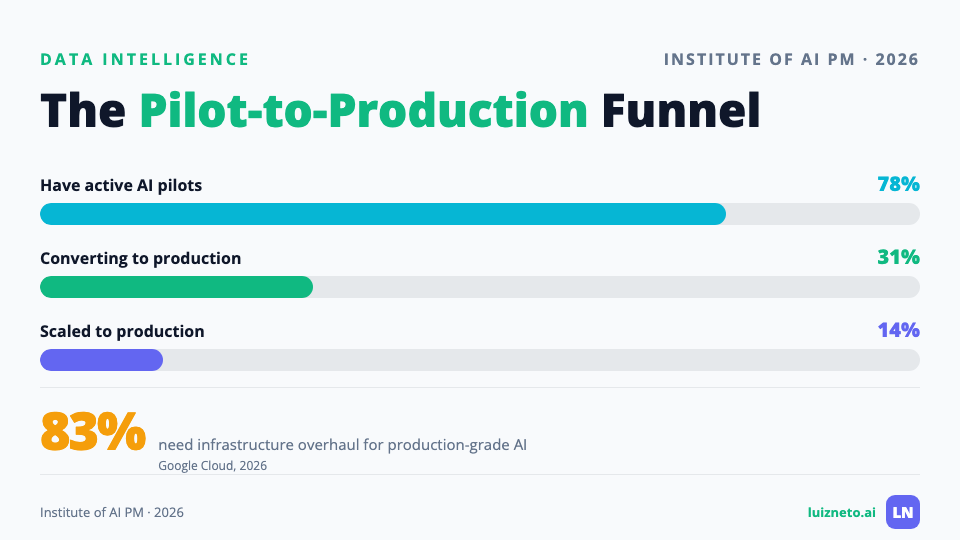
Look at those numbers together. 78% running pilots. 31% converting. 14% scaled. That means more than half of converting pilots stall before they reach full production. They get past the demo, past the approval, past the initial deployment, and then they hit a wall that nobody included in the business case.
Consider two organizations. Both launched AI pilots in Q3 2025. Organization A treated the pilot as a proof-of-concept: small team, sandboxed data, existing infrastructure, success measured by model accuracy. Organization B treated the pilot as a production prototype: cross-functional team, production data pipeline, infrastructure budget earmarked for scale, success measured by business-process impact. By Q2 2026, Organization A has 12 successful pilots and no production deployments. Organization B has 3 pilots and 2 in production, each measurably reducing cost-per-transaction. Organization A has spent more. Organization B has earned more. The difference is what they built around the model, not the model itself.
The wall is architectural. Google Cloud's 2026 infrastructure report found that 83% of organizations need to overhaul their infrastructure to support production-grade agentic AI. That overhaul is not in the pilot budget. It was never in the pilot budget. The pilot budget covers a proof-of-concept on existing infrastructure. The production budget requires infrastructure that does not exist yet.
And 62% report hidden costs from data egress, storage bloat, and idle specialized hardware that the pilot phase never surfaced. These costs arrive at scale, not at proof-of-concept. By the time the CFO sees them, the pilot has already been approved and the team has already moved on to the next demo.
This is pilot purgatory. Not a moment of failure but a structural friction point that separates organizations treating AI as a series of experiments from those treating AI as infrastructure.
The cost of pilot purgatory goes beyond the wasted investment. The real damage is opportunity cost. Every quarter spent running pilots that will never scale is a quarter the organization does not spend building the infrastructure that would make scaling possible. The 95% number lives here. It lives in the space between "it works in the lab" and "it moves the P&L." And it persists because the lab keeps getting funded while the production infrastructure keeps getting deferred to next quarter.
Production reliability is one face of this wall. AI agents in production succeed 56.6% of the time, and that reliability number is a subset of the conversion problem.
The Maturity Curve That Predicts Your ROI
Enterprise AI ROI data follows a maturity curve with four stages and hard numbers at each level.
Prosigns' State of Enterprise AI 2026 report mapped median annualized ROI across four MLOps maturity levels:
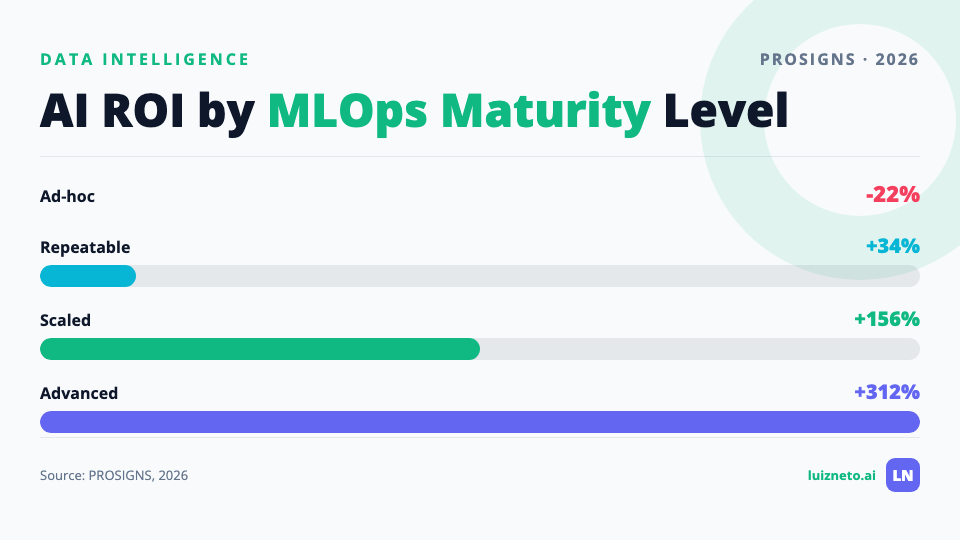
- Ad-hoc operations (-22% median ROI). Manual deployments, no version control, no monitoring. Models run on individual laptops or ad-hoc cloud instances. Every deployment is a one-off. This is where you lose money on AI, consistently, because the cost of operating exceeds the value produced.
- Repeatable processes (+34% median ROI). Standardized pipelines, basic version tracking, some automated testing. The team has a shared process, but it is still manual in key places. ROI turns positive because you stop reinventing deployment every time.
- Scaled automation (+156% median ROI). Automated CI/CD, real-time observability, governance controls embedded in the pipeline. This is the inflection point. The jump from +34% to +156% is larger than the jump from -22% to +34% because automation removes the human bottleneck from the deployment loop.
- Advanced self-service (+312% median ROI). Self-service model deployment, automated governance, continuous optimization loops. Business teams deploy AI without waiting for the data science team. The compounding starts here because the constraint is no longer headcount.
The distance from -22% to +312% tracks operational maturity, not AI model quality. The same model, deployed through ad-hoc processes, destroys value. Deployed through scaled infrastructure, it compounds it.
Enterprises measure AI by the model. They should measure it by the operating model. That is the single reframe this data demands. A better model inside a broken deployment process will produce a more accurate demo and the same zero P&L impact. A decent model inside a scaled operating system will produce measurable, repeatable, compounding returns.
And the payback timeline confirms the pattern. Deloitte (2025) found that AI investments typically take 2 to 4 years to pay back, much slower than traditional technology investments. Only about 6% see payback within a year.
If your board expects annual returns from AI, the maturity curve explains why they are disappointed. The payback arrives, but only after the operating model reaches the scaled stage. Before that, you are paying tuition. The tuition pays off when it builds the operating model. It compounds in the wrong direction when it buys another proof-of-concept on the same ad-hoc infrastructure.
Boards compare AI payback to SaaS deployments that return value in 6 months. The comparison misses the point. SaaS deploys into existing workflows. AI rewrites them. The payback includes the cost of that rewrite.
The question is not "should we invest in AI?" The question is "at what maturity level is our AI operating?" Because the answer to the second question predicts the answer to the ROI question with high accuracy.
Model selection is one of the architecture decisions that shifts where you sit on the curve.
Composable Architecture Is the 6x Multiplier
The single strongest structural predictor of enterprise AI ROI is architectural composability.
The MACH Alliance's 2026 research found that 78% of organizations with fully implemented composable architectures reported clear AI ROI. Among those in early planning stages, just 13%. That is a 6x advantage from architecture alone.
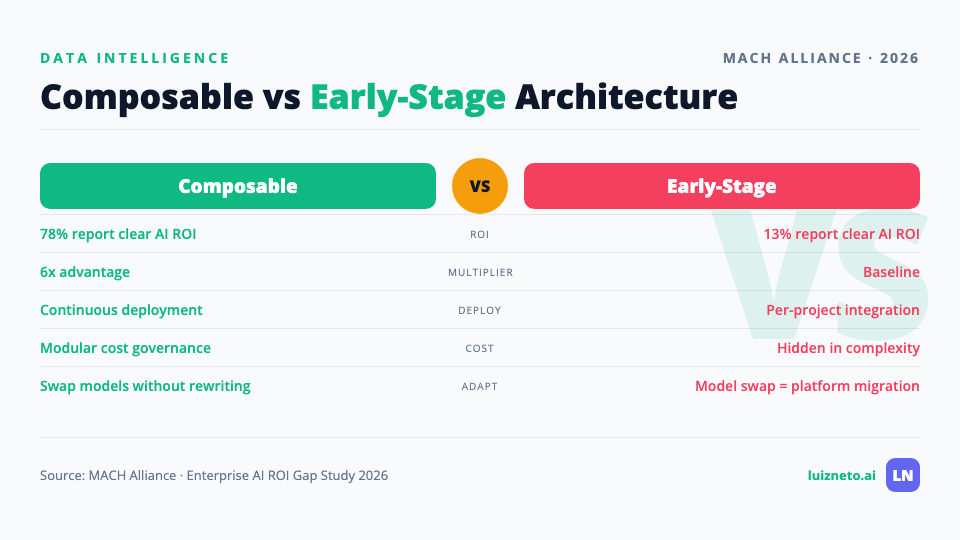
Composable architecture means modular, API-first, headless systems where each component can be replaced, scaled, or upgraded independently. It is the opposite of the monolithic enterprise stack where changing one layer means redeploying everything. If your current stack requires a two-sprint integration project to swap an AI model endpoint, you do not have a composable architecture. And it matters for AI ROI for three specific, measurable reasons.
First, speed to production. Composable systems let you deploy AI models into production without rebuilding the surrounding infrastructure. The pilot-to-production wall shrinks because the architecture was designed for continuous deployment. You don't need a six-month infrastructure overhaul to ship a model that works. You deploy it into a slot the architecture already has.
Second, cost governance. When components are modular, you can monitor, optimize, and replace expensive inference endpoints without touching the rest of the stack. You can swap a $0.03/request model for a $0.003/request model on a single service without rewriting the application. Monolithic systems hide cost in complexity because changing one cost driver means testing everything.
Third, adaptability. AI models change fast. The model you deploy today will be outperformed in 18 months. Composable architecture lets you swap models without rewriting applications. Monolithic architecture turns a model upgrade into a platform migration. And a platform migration means another 2 to 4 years before payback.
The 6x multiplier reflects structural readiness for continuous change. AI compounds as a capability, and it compounds only in architectures designed for compounding.
Every model swap, every cost optimization, every new use case adds value on top of the previous deployment. In a composable system, those improvements stack. In a monolithic system, each improvement requires a new integration project. The top 20% compound improvements quarterly. The bottom 80% restart the integration cycle with every change. Over 2 to 4 years, that compounding difference explains the entire 74%-versus-26% value distribution.
Synthetic data infrastructure is one composable layer enterprises are adopting to accelerate that compounding.
The Measurement Problem That Keeps the Distance Open
Here is why enterprise AI ROI stays invisible for so many organizations: they measure the wrong things at the wrong level.
KPMG's 2026 enterprise transformation survey found that organizations default to operational metrics. The most-tracked indicators tell the story:
| Metric category | Type | Adoption rate |
|---|---|---|
| Productivity improvements | Operational | 39% |
| Time savings | Operational | 36% |
| Cost reduction | Operational | 33% |
| Revenue growth | Strategic | 26% |
| Competitive positioning | Strategic | <26% |
| Margin improvement | Strategic | <26% |
| Source: KPMG, 2026 | luizneto.ai | ||
Three times as many organizations track productivity (39%) as track revenue growth (26%). But boards and investors do not fund AI programs based on productivity reports. They fund them based on income-statement impact.
When you measure task-level productivity but report to a board that wants business-level returns, you have a translation problem. The AI team says "we saved 200 hours per month." The CFO asks "where is the P&L impact?" Neither is wrong. They are looking at different levels of the same system. But the P&L is where the budget decision happens, and if your measurement framework stops at the task level, you will never see the business-level signal even when it exists.
This is how the 95% persists. Pilots succeed in the lab and produce zero on the P&L. The pilots work. The measurement does not.
Only 19% of IT leaders say their AI initiatives have met or exceeded business goals (CIO.com, 2026). The top barriers tell you exactly where the system breaks:
- Lack of in-house expertise (40%). The teams running AI don't have the skills to connect model outputs to business processes.
- Unclear ROI metrics (32%). Nobody defined what "success" means in income-statement terms before the pilot started.
- Murky corporate AI strategy (31%). The AI initiative exists in a strategy vacuum, disconnected from the business plan.
Notice the pattern. All three barriers are upstream of the AI model. The model works. The system around it does not translate model performance into business performance.
And only about 6% of organizations have a coherent organization-wide ROI measurement framework at all. The rest measure what is easy (task-level productivity) instead of what matters (business-level impact). That 6% aligns closely with the 5% who see real P&L results. It is not a coincidence. You find what you measure. And you don't find what you don't measure, even when the value is there.
Building the measurement framework requires strategic work, not just reporting. It requires connecting the AI team's output metrics (accuracy, latency, throughput) to business-process metrics (cycle time, error rate, cost-per-transaction) to income-statement metrics (revenue, margin, market share). Each translation adds a layer of attribution that the current 94% of organizations skip entirely.
Only 28% of AI use cases in infrastructure and operations meet ROI expectations, while 20% fail outright (Gartner, 2026). That 28% success rate traces to measurement, not technology. Fix the measurement, and you start seeing where the value actually accumulates.
Validation is a measurement discipline, not a quality step, and the same principle applies to ROI: if you cannot measure it, you cannot manage it.
The Governance Tax That Pays for Itself
Governance feels like overhead until you measure its return.
Grant Thornton's 2026 AI Impact Survey found that fully integrated AI adopters are nearly four times more likely to report revenue growth than partial adopters: 58% versus 15%. Integration here means AI embedded in governance, compliance, and risk management, not bolted on as a separate initiative run by a different team with a different budget.
| Integration level | Revenue growth reported | Audit confidence (90 days) |
|---|---|---|
| Fully integrated | 58% | Higher (not quantified separately) |
| Partial / siloed | 15% | 22% (78% lack confidence) |
| Source: Grant Thornton, 2026 | luizneto.ai | ||
78% of organizations lack confidence they could pass an independent AI governance audit within 90 days. That carries compliance risk under the EU AI Act, but the direct constraint is on ROI. Ungoverned AI cannot scale. It stalls at the pilot stage, where no one is watching, no one is measuring, and no one is enforcing the discipline that production requires. Without governance, every production deployment is a liability waiting to become a headline. And liabilities do not compound into revenue.
The governance "tax" is real. It costs time, headcount, and tooling. But the data shows it is an investment with a measurable return: organizations that pay it report 4x the revenue growth of those that don't. Treating governance as overhead is the same mistake as treating measurement as optional. Both are load-bearing infrastructure for AI ROI.
The pattern matters here. Composable architecture multiplies ROI. Scaled MLOps lifts it from negative to triple-digit positive. Strategic measurement makes it visible. And governance makes it durable. These are not independent initiatives. They are layers of the same operating model, and the organizations in the top 20% built all four.
Think of it as a building. Architecture is the foundation. Operations is the structure. Measurement is the wiring that tells you what each floor is doing. And governance is the fire code that lets you add more floors without the whole thing collapsing. Skip any one layer and the building stalls at a height that will never house the return your board is looking for.
Governance enables scale. And scale produces ROI.
The incident response playbook is part of the governance stack that drives the 4x.
Enterprise AI ROI FAQ
How do you measure ROI on enterprise AI?
Start with income-statement metrics: revenue growth, margin improvement, cost-per-unit reduction. Operational metrics like productivity and time savings are inputs, not outcomes. Only 6% of organizations have a coherent ROI framework, which is why the 95% failure rate persists (Deloitte, 2025).
Why do AI pilots fail to scale?
83% of organizations need to overhaul their infrastructure for production-grade AI (Google Cloud, 2026). The pilot budget rarely includes this overhaul. Composable architectures convert at 78%; non-composable at 13% (MACH Alliance, 2026).
What is the average ROI of enterprise AI?
It depends on maturity. Ad-hoc operations show -22% median ROI. Scaled operations hit +156%. Advanced operations reach +312% (Prosigns, 2026). The "average" is misleading because the distribution is bimodal, not normal.
How long does it take for AI investments to pay back?
Typically 2 to 4 years, much slower than traditional technology investments. Only about 6% of organizations see payback within one year (Deloitte, 2025). Boards expecting annual returns will be disappointed unless the organization is already at scaled maturity.
What percentage of AI projects deliver ROI?
Only 28% of AI use cases in infrastructure and operations meet ROI expectations (Gartner, 2026). Across all enterprises, 57% still fail to generate positive net ROI (Domino Data Lab, 2026).
Why do executives overestimate AI maturity?
CFOs rate maturity as "leading" at 34.8%; managers at 16.3% (Pigment, 2026). The further you sit from the operational floor, the better the metrics look. This perception distortion keeps the 76%-vs-10% delusion alive (EXL, 2026).
What separates enterprises that capture AI value from those that don't?
Three structural factors: composable architecture (6x ROI advantage per MACH Alliance), scaled MLOps (from -22% to +287% per Prosigns), and governance integration (4x revenue growth per Grant Thornton).
What Happens Next
The distance between the two AI economies will widen, not narrow. As investment scales past the $37 billion mark toward the next trillion-dollar wave, the bimodal distribution intensifies. Organizations with composable architectures, scaled MLOps, strategic measurement, and integrated governance will compound their advantages quarter over quarter. Organizations without them will compound their costs. The math is straightforward: at +312% annual ROI for advanced operations and -22% for ad-hoc, each quarter that passes without building the operating model costs more than the one before.
The structural moves are known. The data is clear from PwC, McKinsey, the MACH Alliance, Prosigns, Grant Thornton, Gartner, EXL, and a half-dozen others. The question is whether your next budget cycle buys more pilots or builds the operating model that makes pilots unnecessary.
Pilot purgatory is a structural condition you engineer your way out of. The 5% that did it have the numbers to prove it. Four layers separate them from the 95%:
- Composable architecture (6x ROI advantage).
- Scaled MLOps (from -22% to +312% median ROI).
- Strategic measurement (income-statement metrics, not task-level productivity).
- Integrated governance (4x revenue growth for fully integrated adopters).
Each is buildable. Each has a measurable return. And each compounds on the one before it. Your board will ask where the AI return is. The answer is not in the model. It is in the operating model. Build the four layers. Measure the right things. And stop celebrating pilots that never reach the income statement.