AI Agents in Production Succeed 56.6% of the Time
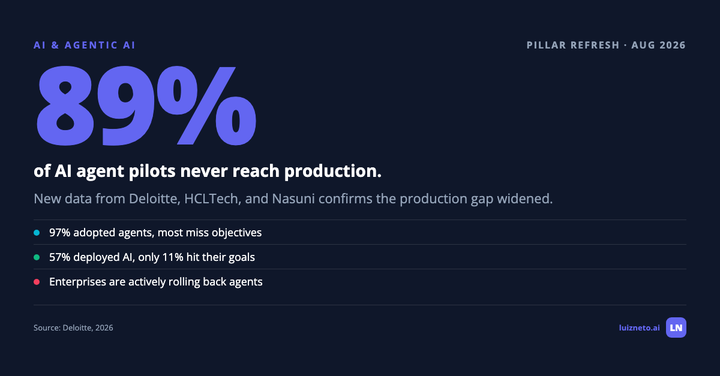
The 2026 agent numbers look contradictory: 46% of POCs reach production, 14% scale, 5% show P&L impact, and telemetry says deployed agents succeed 56.6% of tasks. They measure four different gates of one funnel. Here is the reconciliation and the habits of the minority that scales.
AI Agents in Production Succeed 56.6% of the Time
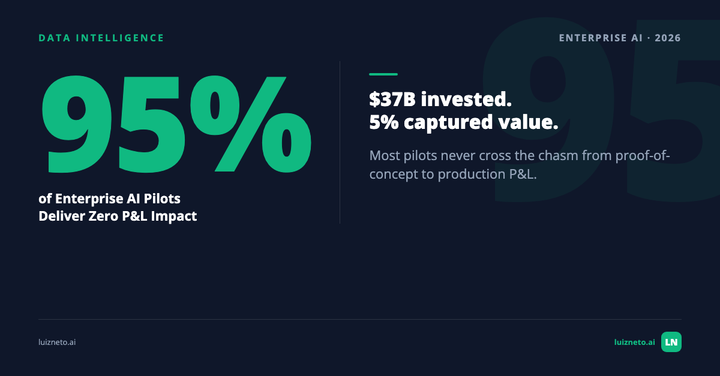
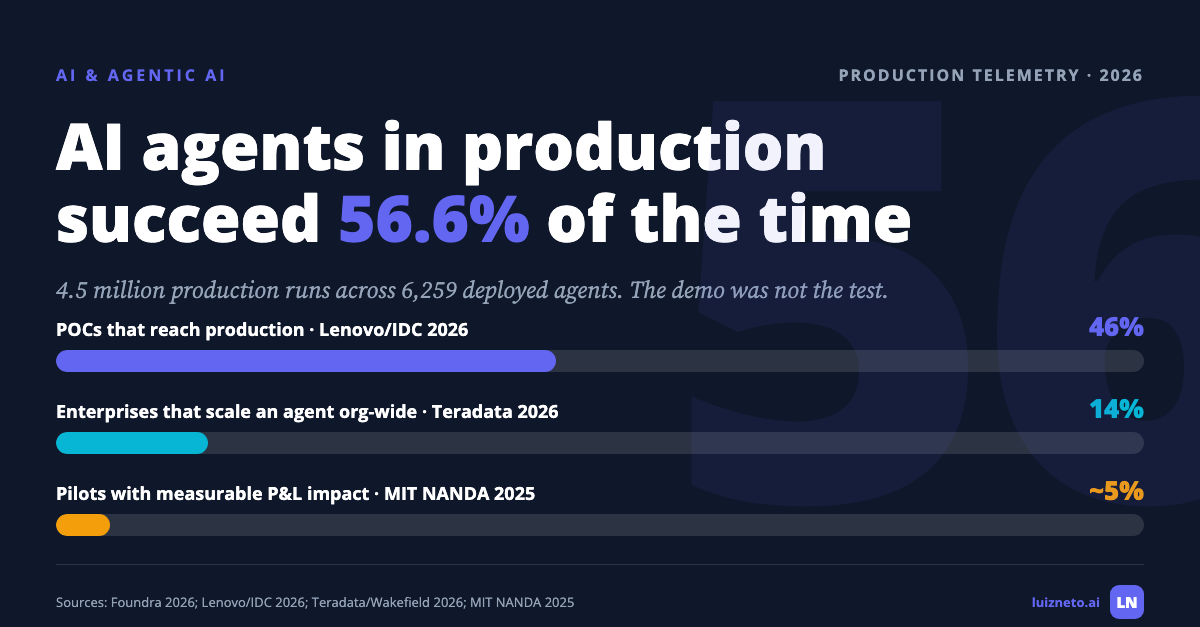
46% of AI proof-of-concepts have progressed into production, according to the Lenovo CIO Playbook 2026. In the same quarter, MIT researchers reported that 95% of enterprise generative AI pilots deliver no measurable P&L impact (MIT NANDA via Fortune, 2025). Both numbers are real. Both are current. Your board has probably quoted one of them at you.
The confusion around AI agents in production is not a data problem. It is a definition problem, and it is deciding budgets right now.
By the end of this piece you will know why the failure statistics disagree, which number applies to which decision, and what the small group that scales agents does differently. Bookmark the reconciliation table below; the next steering meeting will need it.
Key takeaways
- The conflicting failure statistics measure four different funnel gates.
- Production telemetry shows agents succeed 56.6% of tasks.
- Reliability decays from 60% to 25% across eight runs.
- Failures cluster at handoffs, messy inputs, and monitoring seams.
- Teams with standing evaluations ship; teams with dashboards watch.
Contents
- Why every AI agent failure statistic is simultaneously true
- The four gates of the AI agent funnel
- What 4.5 million production runs reveal about AI agent reliability
- An agent that passes once fails the eighth try
- Agents fail at the seams, not the center
- The 2027 cancellation wave is a measurement failure
- What the scaled 14% instrument differently
- AI agents in production FAQ
Why every AI agent failure statistic is simultaneously true
Line up the 2026 numbers side by side and they look like they describe different industries.
Lenovo's CIO Playbook, built on IDC research across 800 European and Middle Eastern organizations, found that 46% of AI proof-of-concepts have already progressed into production (Lenovo and IDC, 2026). A Wakefield Research survey for Teradata found that 78% of enterprises have at least one agent pilot running, yet only 14% have scaled an agent to organization-wide use (Teradata and Wakefield Research, 2026). MIT's NANDA project put the share of generative AI pilots with measurable P&L impact at roughly 5% (MIT NANDA via Fortune, 2025).
So which is it. Nearly half succeeding, one in seven, or one in twenty?
All three. Each study measures a different gate. "Reached production" means a workload runs somewhere with real data. "Scaled organization-wide" means the workload survived contact with every department's edge cases. "P&L impact" means finance can see it without a slide deck explaining where to look. A project can pass the first gate, camp at the second for a year, and never reach the third.
The broader AI numbers carry the same disagreement for the same reason. McKinsey's State of AI survey of 1,993 participants across 105 countries found 39% of organizations report EBIT impact from AI (McKinsey, 2026). PwC's Global CEO Survey of 4,454 executives found only 12% of CEOs say AI delivered both revenue growth and cost reductions (PwC, 2026). Any impact versus impact on both sides of the ledger. Different bar, different number, both true.
Which number should you use? Match it to the decision. Approving a first pilot, use the 46% gate-one rate. Approving an org-wide rollout, use the 14% gate-two base rate and ask what stopped the other 86%. Defending the program to the board, only gate-three numbers count.
The reconciliation looks like this.
| Study | What it measures | Number | What it does not mean |
|---|---|---|---|
| Lenovo CIO Playbook 2026 (IDC) | POCs that reached production | 46% | Not scaled, not necessarily profitable |
| Teradata / Wakefield Research, 2026 | Enterprises that scaled an agent org-wide | 14% | Says nothing about single-team wins |
| MIT NANDA, 2025 | Gen-AI pilots with measurable P&L impact | ~5% | Not "95% of agents are broken" |
| McKinsey State of AI | Organizations reporting any EBIT impact from AI | 39% | AI broadly, not agents specifically |
| Foundra production telemetry, 2026 | Task-level success across deployed agents | 56.6% | Not a project count; a per-run rate |
| Sources: Lenovo/IDC 2026; Teradata/Wakefield 2026; MIT NANDA via Fortune 2025; McKinsey 2026; Foundra 2026 | luizneto.ai | |||
One caution from checking these at the source. A widely shared version of the IDC finding claims that "for every 33 AI POCs, only 4 reach production." That figure does not appear in the actual Lenovo report, whose published number points the other way. If a statistic arrives without a link to the primary document, treat it as unverified.
The gates only make sense as a sequence. For how fast enterprises are actually adopting, see the state of AI agents in 2026 and what 40% enterprise adoption actually looks like.
The four gates of the AI agent funnel
Think of it as an engineering acceptance chain, the same way a bridge design passes load review before anyone pours concrete.
Gate one is production. The agent runs on live data with real users. Lenovo's 46% says almost half of POCs get here (Lenovo and IDC, 2026). This gate filters for basic integration competence, and passing it is the cheapest win in the chain. The failure mode here is mechanical: authentication, permissions, an API that behaves differently outside the sandbox. Expensive to debug, cheap to diagnose.
Gate two is scale. The agent survives other teams' data, other regions' formats, other managers' expectations. Teradata's 14% says six out of seven organizations stall between gate one and gate two (Teradata and Wakefield Research, 2026). Gate two fails on variance. The pilot team curated its inputs without noticing. The second team's inputs arrive uncurated, and the success rate quietly drops until someone escalates. Nothing broke. The distribution changed.
Gate three is P&L. The finance team can point at a line the agent moved. MIT's 5% lives here (MIT NANDA via Fortune, 2025). What fails at this gate is attribution. The agent saves ninety seconds per ticket, the team absorbs the slack, headcount stays flat, and at review time nobody can find the money. Value that is not instrumented at the start is unprovable at the end.
Gate four is reliability under repetition, and it is the gate nobody puts on the slide. An agent can clear all three business gates on averages while failing the same user four times in one afternoon. The next two sections put numbers on that.
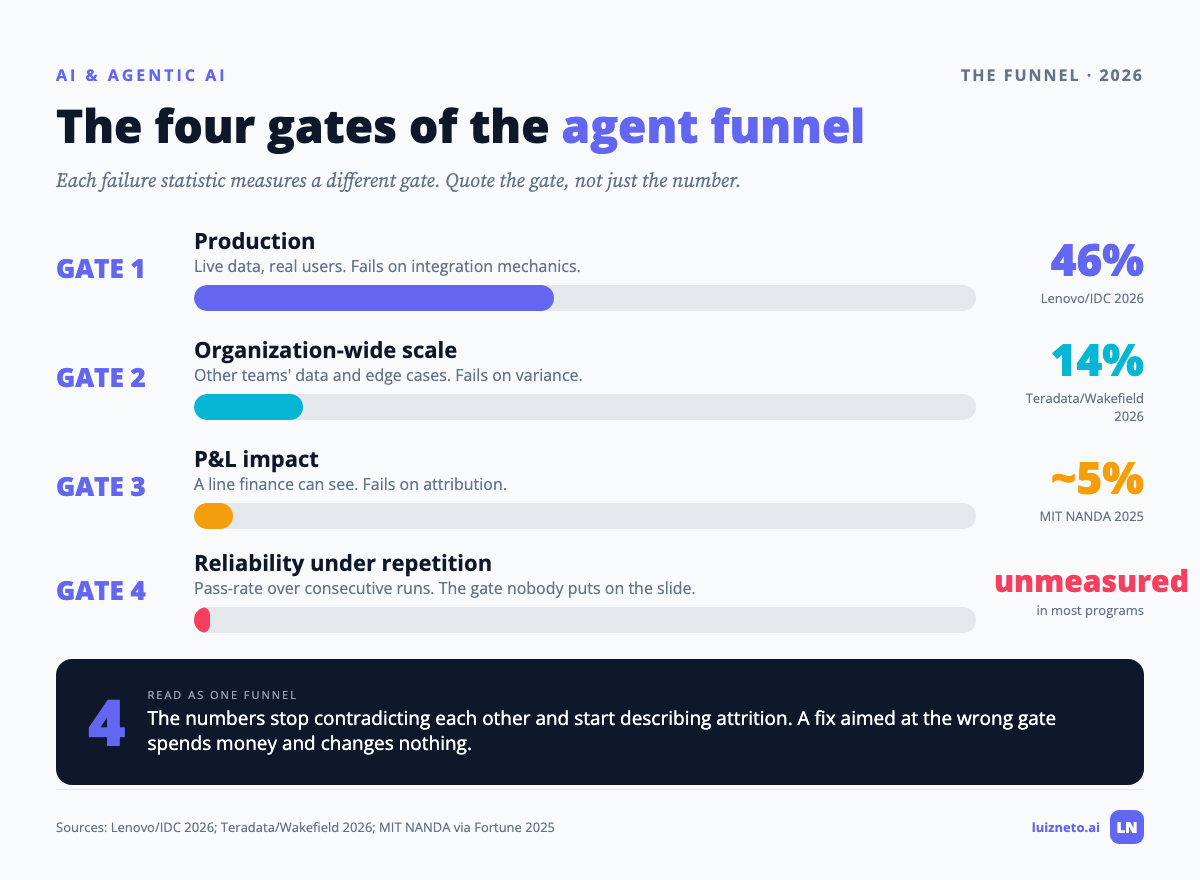
Read as a funnel, the numbers stop contradicting each other and start describing attrition. Each gate has its own failure class: integration at one, variance at two, attribution at three, decay at four. A fix aimed at the wrong gate spends money and changes nothing.
Gate confusion also explains why agent budgets wobble. Funding decisions built on gate-one numbers meet results measured at gate three. The distance between those two numbers is where programs lose executive sponsorship, the same dynamic that stalls portfolios in enterprise AI programs without a model portfolio strategy.
What 4.5 million production runs reveal about AI agent reliability
Surveys ask people what happened. Telemetry watches it happen. In 2026 we finally got telemetry at scale.
Foundra collected production data across 6,259 deployed agents and measured a 56.6% task success rate over 4.5 million runs (Foundra, 2026). Not a lab. Not a benchmark harness. Deployed agents doing assigned work, succeeding slightly more often than a coin flip.
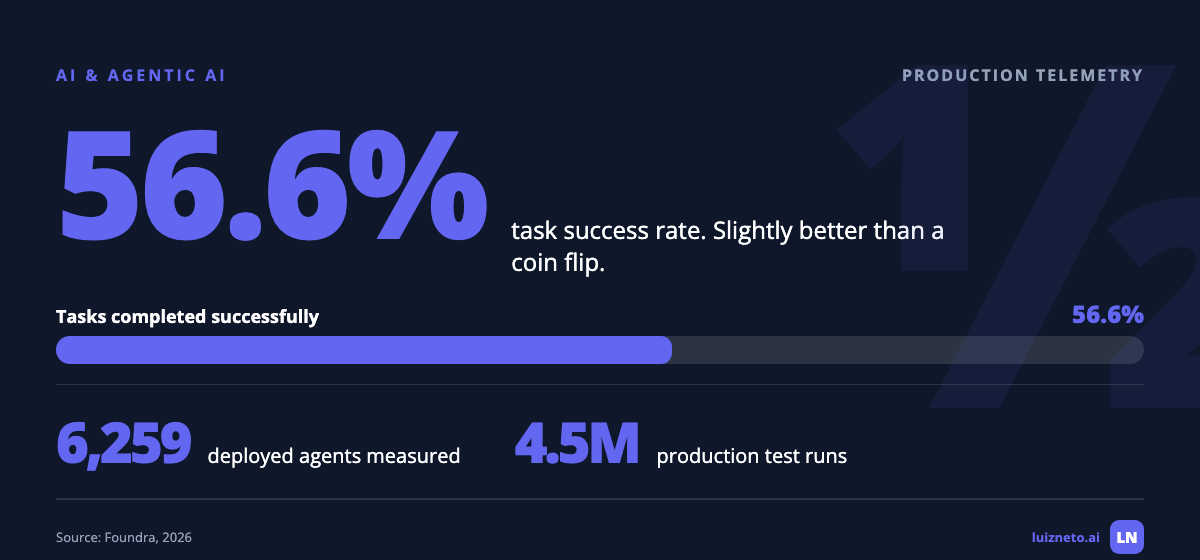
Vendor syntheses put a wider band on the same reality. Fiddler AI's review of production deployments concludes that agents fail between 70% and 95% of the time, depending on task complexity and on how you count success (Fiddler AI, 2026). The spread between 56.6% success and those failure bands is itself informative: strict end-to-end task completion produces the ugly numbers, partial-credit scoring produces the flattering ones. Ask which definition a vendor is using before you accept their reliability slide.
The definition question is worth two minutes in every review meeting. Count a task as successful when the agent drafted a correct answer that a human then fixed, and your rate climbs. Count it only when the ticket closed without human touch, and the rate falls hard. Both definitions are legitimate. The mistake is reporting one while budgeting on the other.
Here is the part that should reframe the boardroom conversation. Adoption is rising anyway. LangChain's survey of over 1,300 practitioners found 57% of organizations now run agents in production, up from 51% a year earlier (LangChain, 2026). And when the same survey asked what blocks deployment, the top answer was not cost, talent, or regulation. It was quality. 32% named reliability as the single biggest barrier (LangChain, 2026).
The constraint has moved from appetite to trust. Trust has a measurable shape, and the next section draws it.
This is the same lesson enterprise analytics learned a decade ago: a system that is right on average and wrong unpredictably gets turned off. The lineage of that argument is in why prediction is not intelligence in enterprise AI.
An agent that passes once fails the eighth try
The single most useful agent statistic of the past two years came from an academic benchmark, not a vendor. The τ-bench team at Sierra measured agents on realistic customer-service tasks, then asked a question almost nobody asks in a demo. Not "can it succeed?" but "does it succeed every time?"
Agents that scored around 60% on a single attempt dropped to roughly 25% when required to succeed eight consecutive times on the same task (τ-bench, Sierra, 2024). Same agent. Same task. The only variable was repetition.
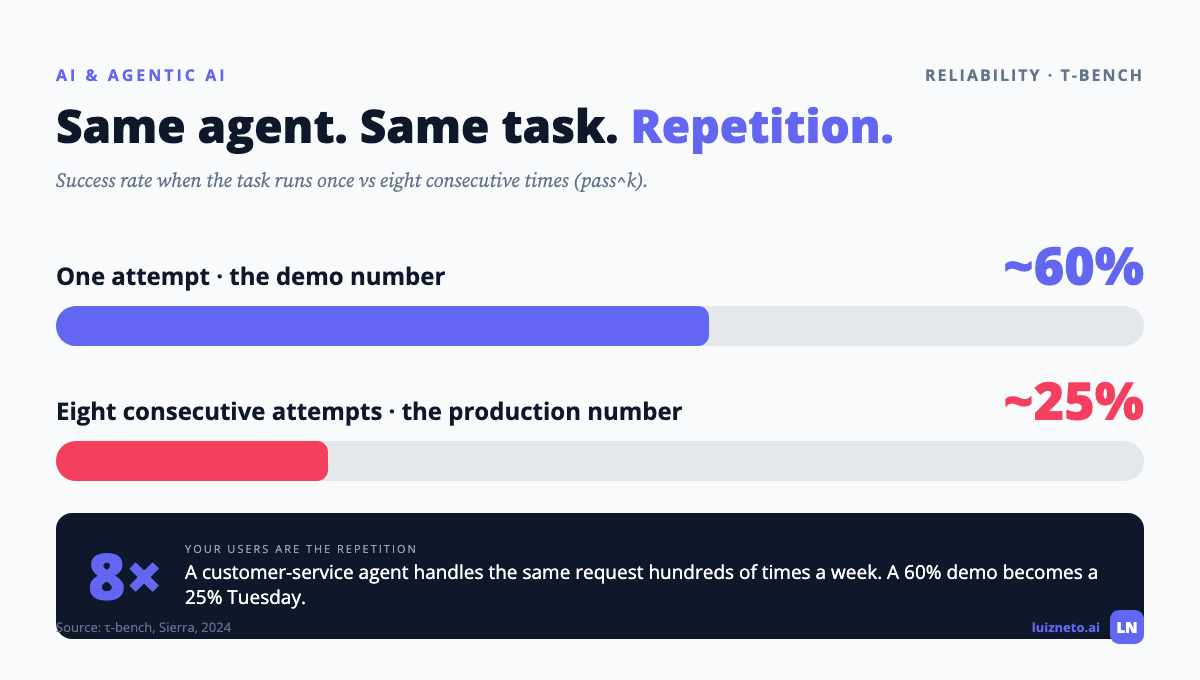
Your users are the repetition. A customer-service agent handles the same refund request hundreds of times a week. A 60% demo becomes a 25% Tuesday.
The mechanism is ordinary arithmetic, the same compounding an engineer applies to any multi-step system. Run the numbers yourself: a step that succeeds 95% of the time, chained ten times, completes end-to-end about 60% of the time. Chain the whole task eight times in a row and the compound keeps falling. Agents are chains. Every tool call, retrieval, and handoff multiplies its error into the total, which is why single-shot demo scores systematically overstate what a week of production will deliver.
Capability is whether the agent can succeed once. Reliability is whether it stops failing. Enterprises pay for the first and bleed on the second.
The older evidence pointed the same direction. On the WebArena benchmark, the best GPT-4-based agent completed 14.41% of end-to-end web tasks. Humans completed 78.24% of the same tasks (WebArena, CMU, 2023). Models have improved since, but the measurement discipline is the durable lesson: end-to-end completion under repetition, not single-shot highlights.
Hold any agent to the standard you would hold a new hire to. A team member who completed one task in seven, or failed three of four assignments on the eighth repetition, would trigger a performance conversation. That framing matters more as agents take seats on teams, a shift covered in why AI agents are team members, not tools.
Agents fail at the seams, not the center
If reliability decays this predictably, the next question is where the failures actually happen. The telemetry has an answer, and it is quietly good news.
Foundra's production data shows a roughly 37% performance drop between benchmark scores and enterprise deployment for comparable tasks (Foundra, 2026). The failures behind that drop cluster in three places: handoff boundaries between tools and systems, messy inputs the demo never saw, and monitoring blind spots where nobody notices the agent has been wrong for a week.
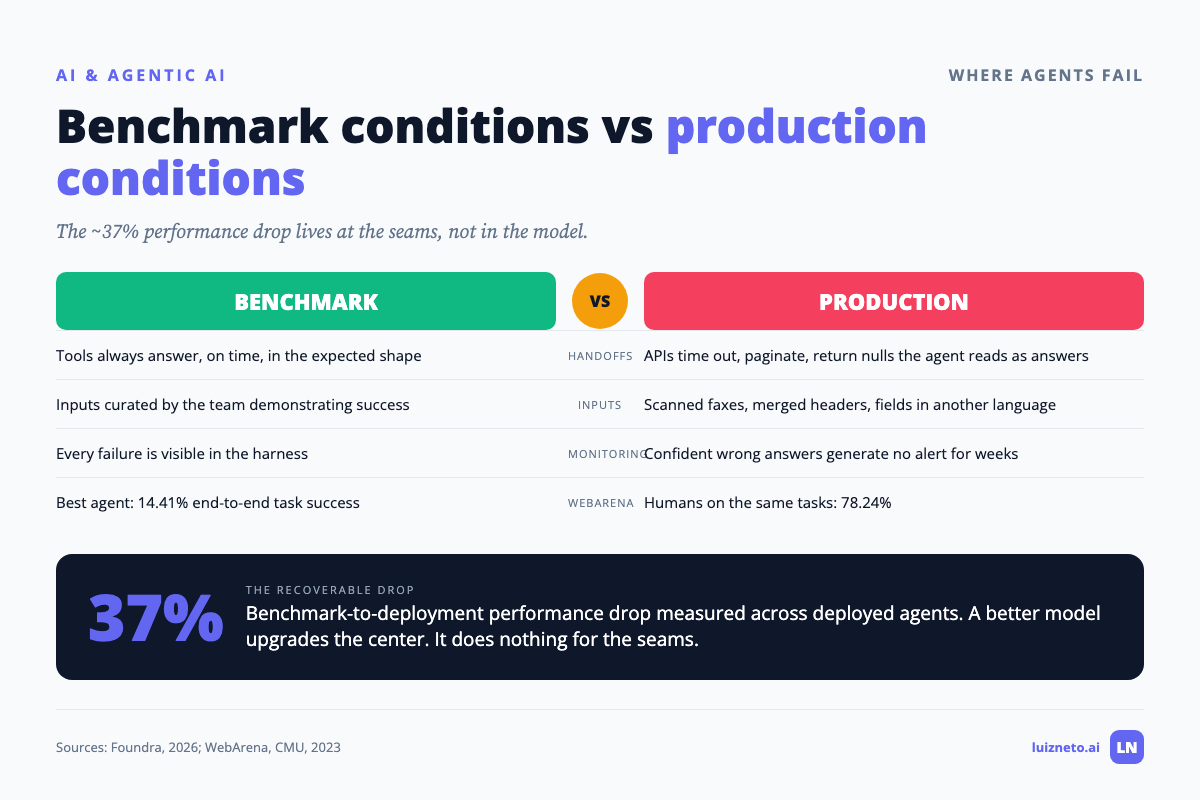
Notice what is not on that list. Raw model capability. The center of the agent, the model, mostly does its job. The seams are where production differs from the benchmark: the CRM API that returns a null, the invoice PDF scanned at an angle, the escalation path that exists in the runbook but not in the code.
Walk through the three seams as an engineer would.
Handoff boundaries. Every transfer between the agent and a tool, another agent, or a human is a contract, and most of those contracts are implicit. The benchmark version of the tool always answers. The production version times out, paginates, or returns an empty list that the agent reads as an answer. Explicit contracts with failure branches close this seam.
Messy inputs. The pilot's documents were the clean ones, because pilots select for demonstrable success without anyone deciding to cheat. Production sends the scanned fax, the field in Portuguese, the spreadsheet with a merged header row. Input validation in front of the agent is cheaper than reasoning ability inside it.
Monitoring blind spots. A wrong answer that looks confident generates no error, no alert, and no log line worth reading. The failure surfaces weeks later as a customer complaint or an audit flag. This seam is the quiet one, and it is the one that ends programs.
This diagnosis should change your spending. A better model upgrades the center. It does nothing for the seams. Teams that rebuild their integration boundaries, input validation, and observability capture the 37% that benchmarks promised and production withheld.
The messy-inputs seam deserves special attention because it is the one your data organization already owns. An agent inherits every data-quality debt you have deferred. The unglamorous fix lives in how to prepare enterprise data for AI success.
The 2027 cancellation wave is a measurement failure
Gartner predicts that more than 40% of agentic AI projects will be canceled by the end of 2027, citing escalating costs, unclear business value, and inadequate risk controls (Gartner, 2025). Read those three causes again. None of them is "the model was not smart enough."
Unclear business value is a gate-three instrumentation failure. Escalating costs without a reliability curve to justify them is a gate-four blindness. Inadequate risk controls means nobody could say what the agent did last Tuesday. The coming cancellations trace to measurement debt: nobody instrumented the right gate, and the CFO eventually stopped accepting vibes as a KPI.
Consider two leaders running the same pilot. Person A funds a demo, reports gate-one progress in gate-three language, and discovers at budget time that "in production" and "producing value" were different claims. Person B publishes a per-gate scorecard from week one: integration status, variance under other teams' data, an attributed cost line, a pass-rate curve. Person A's project is in Gartner's 40%. Person B's project gets defended by the CFO personally.
The difference between them was never technical talent. Both teams shipped a working agent. Person A's agent may even score higher in isolation. The difference is that Person B can answer the three questions Gartner's cancellation causes translate into. What does this cost per resolved task, and which direction is that trending? What value line does it move, in whose budget? What did it do last Tuesday, and who signed off on the risky parts? Three answers, sourced from instruments, delivered without preparation. That is what "adequate risk controls" looks like from a boardroom chair.
The investor framing makes the same point faster. Nobody holds a position through a drawdown without a thesis and a number that would falsify it. An agent program without a per-gate scorecard is a position without a thesis. The 2027 cancellations will be the margin calls.
The stakes are already visible in the ROI numbers. PwC's 2026 Global CEO Survey of 4,454 executives found only 12% of CEOs report AI delivering both revenue growth and cost reductions (PwC, 2026). The scaled minority is real, and it is small.
Boards do not need more optimism or more fear. They need five questions with measurable answers, starting with the questions every board should ask about AI agent governance.
What the scaled 14% instrument differently
The exit from this maze is boring, cheap, and already documented. That is the productive part of the discomfort.
LangChain's engineering survey found 89% of teams have implemented observability for their agent systems. Only 52% run offline evaluations against test sets, and only 37% run online evaluations on live traffic (LangChain, 2026).
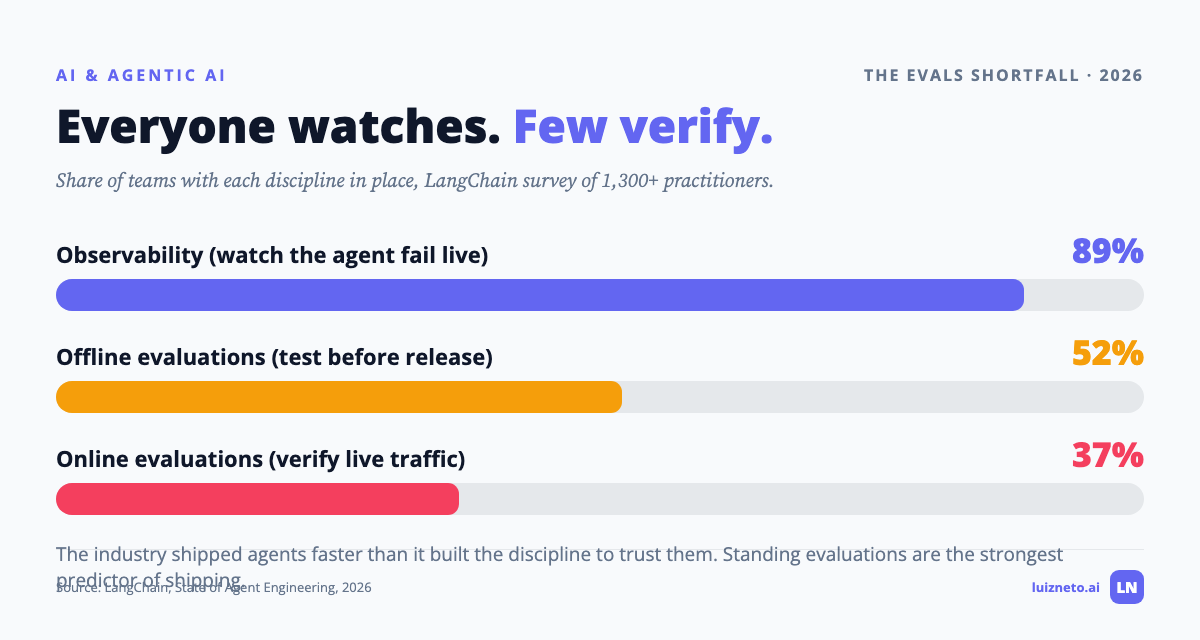
Sit with that spread. Nine in ten teams can watch their agent fail in real time. Half can tell you before deployment whether a change made the agent better or worse. Barely a third continuously verify the thing users actually experience. The industry shipped agents faster than it built the discipline to trust them.
Observability tells you what already happened. An evaluation stops a bad release before users meet it. The scaled minority treats standing evaluations as the shipping gate: a fixed test set that every prompt change, tool change, and model upgrade must pass, plus online checks that alarm on decay instead of discovering it at renewal time.
The pattern behind the 14% comes down to three habits. Scope narrow enough that the test set covers reality. Standing evals wired into the release path. Human checkpoints exactly at the handoff seams the telemetry flags. None of this requires a frontier lab. All of it requires deciding that 56.6% is a measurement to improve, and never an acceptable resting state.
What does a standing evaluation suite actually contain? Four things, in order of construction. A frozen test set of real cases, including the ugly ones the pilot excluded. A strict success definition, agreed with the business owner before the first run. A threshold that blocks release when the score drops. And a growth rule: every production failure becomes a new test case within the week. The suite starts small. Fifty honest cases beat five hundred synthetic ones.
Notice the investment profile. This is process discipline, priced in engineer-weeks, competing against model upgrades priced in six-figure contracts. The telemetry says the discipline wins: the seams, not the center, hold the recoverable 37%. The budget usually flows the other way anyway, because a model upgrade is a purchase order and a discipline is a habit. The 14% built the habit.
Where does an executive start? Treat the agent program as an operating model rather than a model purchase. The five-layer version is laid out in the enterprise agent control plane.
AI agents in production FAQ
Why do AI agents fail in production?
Production failures cluster at three seams: handoff boundaries between tools and systems, messy real-world inputs the pilot never saw, and monitoring blind spots. Foundra's 2026 production telemetry found a roughly 37% performance drop from benchmark to deployment, driven by these seams rather than by raw model capability (Foundra, 2026).
What percentage of AI agent projects fail?
It depends on the gate you measure. 46% of POCs reach production (Lenovo/IDC, 2026), only 14% of enterprises scale an agent organization-wide (Teradata/Wakefield, 2026), and roughly 5% of generative AI pilots show measurable P&L impact (MIT NANDA, 2025). Quote the gate, not just the number.
How do you measure AI agent reliability?
Measure repeated success on the same task, not single attempts. τ-bench showed agents scoring about 60% on one attempt fall to roughly 25% when required to succeed eight consecutive times (τ-bench, Sierra, 2024). Track pass-rate curves over consecutive runs, plus end-to-end completion instead of partial credit.
What is the difference between an AI agent pilot and production?
A pilot proves the agent can work for one team on curated data. Production means live data, real users, and accountable uptime. Scale is a third, harder state: surviving other departments' edge cases. Surveys show 78% of enterprises have pilots while 14% reach organization-wide scale (Teradata and Wakefield Research, 2026).
How many companies use AI agents in production?
57% of organizations report running AI agents in production, up from 51% the prior year, according to LangChain's survey of more than 1,300 practitioners. Adoption keeps climbing even though quality and reliability remain the most-cited deployment barrier, named by 32% of respondents.
The next budget cycle will fund instruments, not demos
The 2026 measurement wave ended the faith era of enterprise agents. The numbers now exist to know which gate your program is standing at and what failure looks like there. That changes the executive job: stop asking whether agents work and start asking your teams for the pass-rate curve, the per-gate scorecard, and the eval suite that gates each release.
The organizations that scale agents next year will look unremarkable this year. Narrow scope, standing evaluations, human checkpoints at the seams. Boring wins compounding quietly.
If this reconciliation saved you an argument, the weekly analysis goes deeper. Subscribe to the newsletter for the data behind enterprise AI decisions, or start with the enterprise agent control plane.